
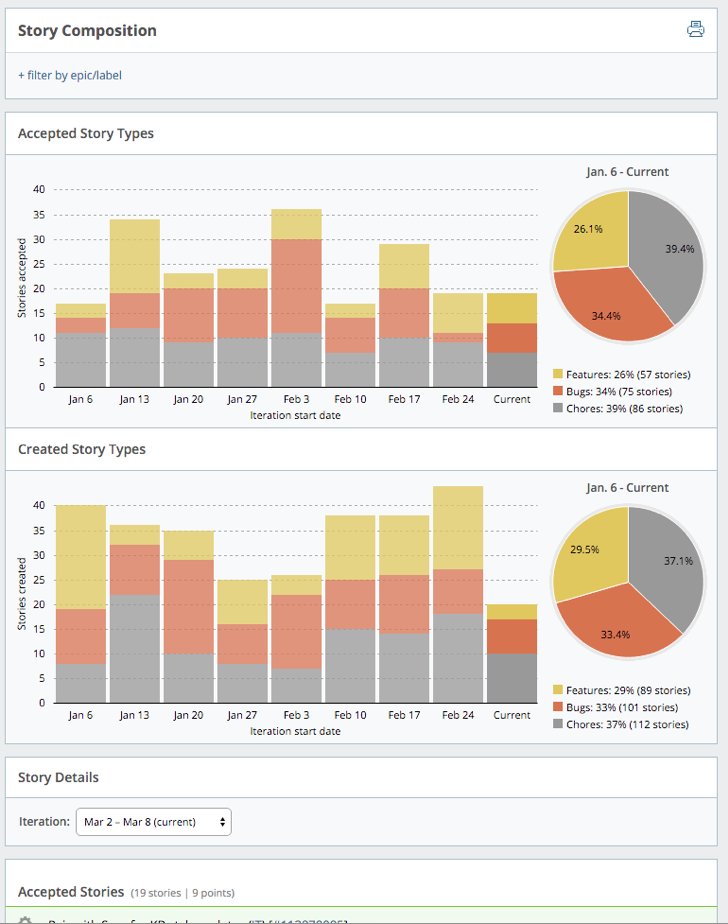
The Story Composition report shows stories that were accepted or added in recent iterations, broken out by type (i.e., features, bugs, or chores). The pie charts show the aggregate of these story types over the time frame.
Story Composition helps provide context to project progress and check the balance of the work being done. There are several things you can do with this chart:
-
Identify “story walls” early. Often, a new development initiative will start with a high percentage of feature stories. When issues with delivered stories are found in subsequent iterations, the project hits a “bug wall.” The Story Type chart shows both accepted and incoming stories, so you can predict when new work will take longer.
-
Understand the history of an epic/label. Filtering by an epic or label allows you to visualize its story history. Seeing how an epic/label evolves (e.g., stories accepted vs. created) is a powerful tool for retrospection. This is useful information when you estimate future initiatives.
Using this report
Click view report to the right of Stories accepted on the Project Overview chart.
The Accepted Story Types chart and Created Story Types chart show activity for recent iterations, as well as the current iteration. You can mouse over any section of the chart to display the number of accepted or created features, bugs, and chores for each iteration.
To see the data for just an epic or label, click + filter by epic/label, type the first few letters of the epic or label name, and then select the one you want. One epic/label filter can be applied at a time, allowing you to drill down into a specific feature.
To see story activity for any day within the last six months, choose an iteration for the Story Details report.
Mouse over initials to see someone’s full name, and click the story ID to open the full-page view of that story.