
This report gives an overview of project trends and metrics to help you assess its health and pace. You can see the big picture, then drill down for more detail to see exactly what’s going on. The Project Overview report lets a team quickly identify unwanted trends to address and positive results to celebrate.
Using this report
Click Project at the top of the Analytics sidebar.
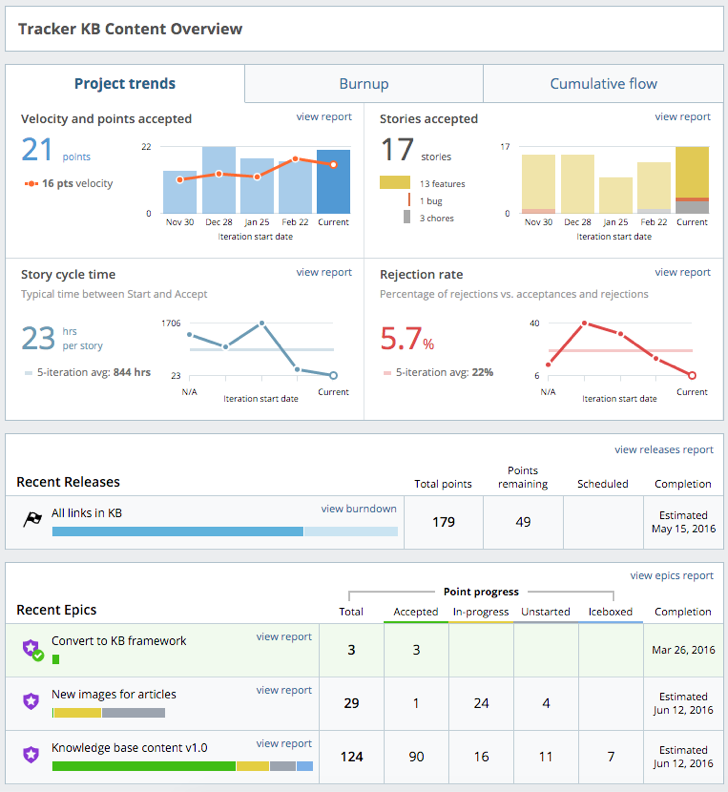
The top section of this report allows you to see useful trends at a glance, including the following:
-
Velocity and points accepted displays the number of points in accepted stories per iteration, with a trendline for your project velocity. How consistent is your team’s pace?
-
Stories accepted shows the ratio of features to bugs and chores, by iteration. Is the team getting bogged down in bug fixes and technical debt?
-
Story cycle time demonstrates the time spent on stories by state, story type, or points, and shows all the stories in a given iteration. How long does it typically take to get stories from started to accepted, and is this increasing or decreasing?
-
Burnup shows the overall progress of the project in terms of points completed vs. total number of prioritized points, over time. It can help identify feature or scope creep, and help explain why end dates keep getting pushed out.
-
Cumulative Flow helps visualize your project’s rhythm in terms of the story “flow” through the prioritize > start > finish > deliver > accept/reject states. Are there bottlenecks with acceptance, for example?
The Project Report also shows information about the most recently completed and in-progress releases and epics.
Drill down into any of the information shown with the view links to see detailed reports:
-
Click view burndown next to a release to see its Burndown chart and the accepted stories in it.
-
Click view report next to an epic to see its Epics Progress report.
Most reports let you filter by epic or label, switch to story counts vs. points, adjust the displayed date range, and see the specific stories that contributed to the bars, lines, and iterations a chart shows.