
The Custom CI/CD Pipeline Integration gives teams the power to see whether their builds have passed or failed directly in Tracker, while also providing three new metrics to help teams better track the value they are delivering to users. With this Integration, teams can connect any CI/CD tool they use to Tracker.
Project owners, account owners and admins can create a Custom CI/CD Pipeline Integration to track when features are delivered to their production environment.
Creating a Custom Integration
Add a Custom Integration to a Project
- Click the INTEGRATIONS tab in top navigation
- Select the Add an Integration button at the top of the page, then choose Custom CI/CD Integration
Configure the integration
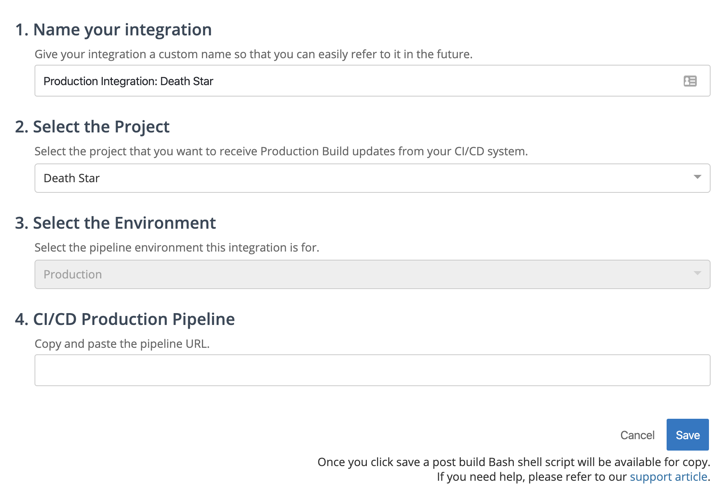
- Name Your Integration: It’s important to give the integration a unique name, so that you and your team can easily identify the integration if you need to make changes.
- Select a Project: By default, Tracker will populate the name of the project where you are trying to setup the integration. Currently, your CI/CD Pipeline Integration will only apply to 1 project.
- Select the Environment: By default, Tracker populates this field to refer to your production environment. At the moment, the CI/CD Pipeline Integration only supports connections to production environments. This field is not editable.
- CI/CD Production Pipeline: Be sure to grab the URL of your pipeline in whatever CI/CD tool you use.
After you complete this information and hit Save. Two bash script snippets will appear below the form you just completed. You will need to paste both of these snippets into your CI/CD tool to see the build pass and build fail comments in Tracker.
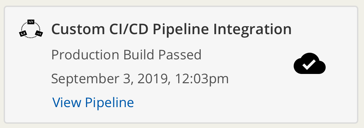
Successful Setup
Once the CI/CD Pipeline Integration has been successfully created, you will begin to see build pass and build fail messages in the expanded story view.
Production Metrics
With the Concourse Pipeline Integration, you will find 3 new metrics on the Project Overview page in Analytics. At the moment, these metrics do not have drilldown reports.
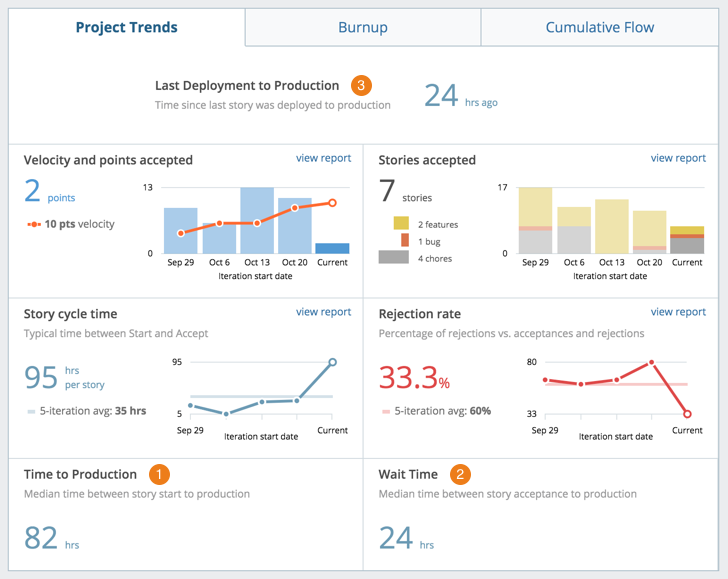
- Time to Production: total active time on a story from start to production
- Wait Time: total active time on a story from acceptance to production
- Time Since Last Deployment to Production