
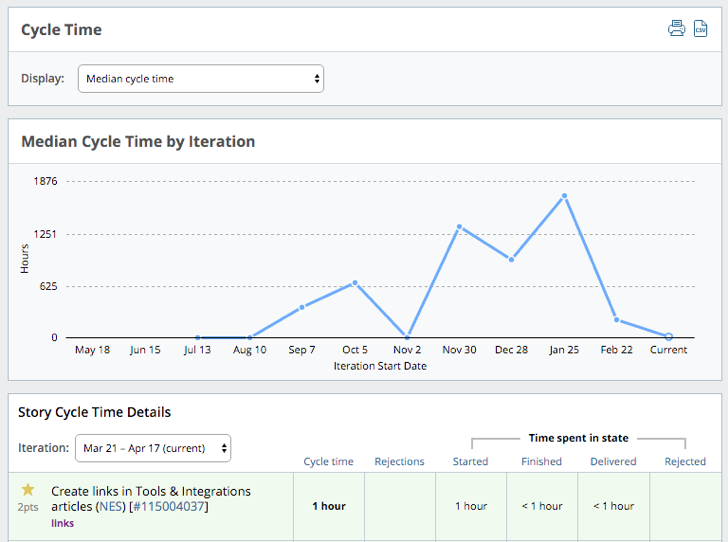
The Cycle Time report shows the median number of weekday (Mon - Fri) hours spent on stories, and cycle time by state, story type, or points, as well as the rejection rate. The Details section lists all the stories in the selected iteration.
In Tracker, cycle time measures the time from when a story is first started to the final date it’s accepted. If a story was started and/or accepted multiple times, Tracker uses the earliest start date and the latest accepted date to compute cycle time.
There are several things you can do with this chart:
Track progress. The Cycle Time chart shows how quickly your team is completing stories from start to finish. Tracking your project’s cycle time helps you find ways to shorten that feedback loop. The cycle time details allow you to identify stories with an unusually long cycle time and consider how cycle time could be safely shortened.
Identify issues. Rejection rate is shown, both on the Project Overview chart and in the Cycle Time report. Stories that remain in the rejected state for a long time are likely blocked and need further action before they can be worked on again. A large number of rejections may mean stories are not well understood and more discussion or definition might be needed before they are estimated.
Manage scope. Longer cycle times may mean stories are too big, or that the team lacked a shared understanding about the stories before and during development.
Using this report
Click view report to the right of Story cycle time on the Project Overview chart, or click Cycle Time in the Analytics sidebar.
Choose different views of the Cycle Time report with the following Display menu items:
-
Median cycle time
-
Cycle time by state
-
Cycle time by point
-
Cycle time by story type
You can also choose an iteration for which you want to see Story Cycle Time Details, and see cycle time, number of rejections, and time spent in active states for each story in the selected iteration.
The story order defaults to priority order by state. Click the column headers to change the sort order (e.g., order by Cycle Time descending).
Mouse over initials to see someone’s full name, and click the story ID to open the full-page view of that story.
Stories shaded green represent those in the accepted state, and are no longer calculating cycle time. Stories shaded yellow are still in an active state (started, finished, delivered or rejected) and therefore, cycle time is still being calculated until they’re accepted.
Rejection rate
Rejection rate is the percentage of features and bugs accepted during the iteration that have ever been rejected.
rejection rate = the number of Feature and Bug type stories accepted during the iteration that have ever been rejected /
total number of feature or bug stories (stories that can have a rejected status) accepted during that iteration