
The Epics report provides an overview of the project’s epics and provides visibility to epic size (i.e., the number of stories or total points) and status.
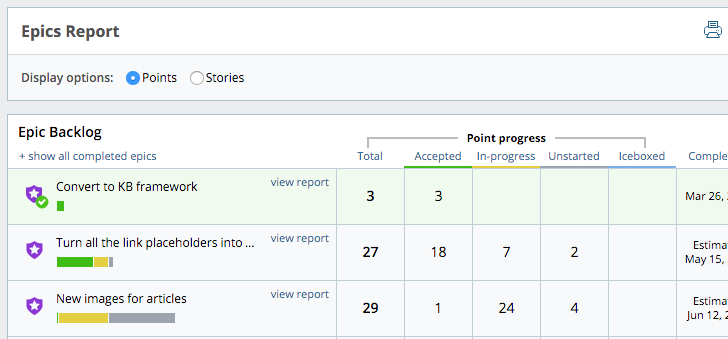
Each epic has a progress bar to indicate how many stories or points in the epic are in each state, depending on the display option you select. With the Stories display option selected, this bar is similar to the epic progress bar in the Epics panel in a project.
There are several things you can do with this chart:
-
Visualize active and upcoming epics, see where things stand in terms of progress, and see when your epics might be completed, based on prioritized stories.
-
Drill down into any epic to see how that epic has grown, what stories are part of it, and more.
Using this report
Click Epics in the Analytics sidebar.
The view report link takes you to the Epic Detail report for that epic.
Choose to display counts for the total number of Points or Stories in the epics and in various stages of the workflow. In-progress refers to stories in the Started, Finished, Delivered, or Rejected states, and Iceboxed refers to stories in the Icebox panel (i.e., in the unscheduled state).
Epics are shown in this order:
-
Recently Completed displays all planned stories that were accepted in the past two iterations.
-
In-progress includes at least one in-progress story in the current iteration.
-
Upcoming has stories in the Backlog—possibly together with stories accepted in previous iterations—or the Icebox only.
Click + show all completed epics to see epics in which all prioritized stories have been accepted. For more on what determines when an epic has been completed, please see When is an epic done?.
Download Epics report as CSV
To download the report as a CSV file, select the CSV icon located near the top right of the report. The CSV version will include the following data points:
- ID: the epics unique ID
- State: there are four possible states for epics:
- Completed: All of the planned stories (scheduled in the backlog) associated with the epic have been accepted. Stories in the Icebox do not count towards an epics completion.
- In-Progress: One or more planned stories have yet to be accepted.
- Planned: Stories in the epic have been planned (scheduled in the backlog), but none of them have been started.
- Unplanned: All stories in the epic are unscheduled (not planned / in the Icebox).
- Title: the title of the epic
- Total Stories: the total number of stories associated with the epic
- Number Completed: the total number of stories that have been accepted in the epic
- Number In-progress: the total number of stories in the states of
started,finished,deliveredorrejectedin the epic - Number Planned: the total number of stories that are currently scheduled in the Backlog for the epic
- Number Not Planned: the total number of stories that are currently unscheduled (in the Icebox) for the epic
- Total Points: the total number of points associated with all stories in the epic
- Points Completed: the total number of points for all stories that were accepted in the epic
- Points In-progress: the total number of points for all stories that are in the states of
started,finished,deliveredorrejectedin the epic - Points Planned: the total number of points for all stories scheduled in the Backlog for the epic
- Points Not Planned: the total number of points across all unscheduled stories (in the Icebox) for the epic
- Projected Completion: the date Tracker estimates an In-Progress epic will be completed, based on velocity
- Completed At: the date an epic was completed
Epic Detail report
The Epic Detail report shows progress toward the completion of a single epic.
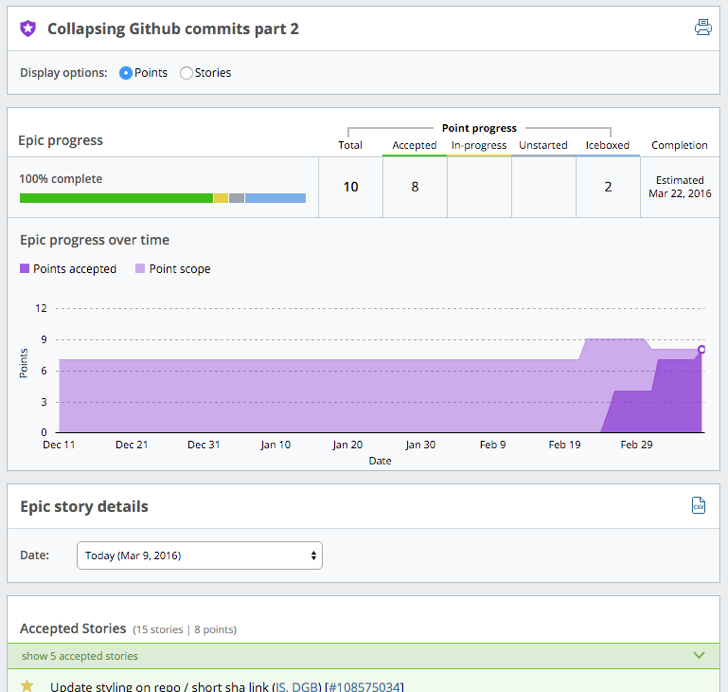
The epic has a progress bar to indicate how many stories or points (depending on the display option you select) in the epic are in each state. With the Stories display option selected, this bar is similar to the epic progress bar in the Epics panel in a project. It also has a Burnup chart that shows the total number of accepted story points vs. the total number of prioritized points for the epic.
There are a couple of things you can do with this chart:
-
See progress towards completion.
-
Monitor the stories that are in the epic, and identify how scope has changed over time.
Using this report
Click Epics in the Analytics sidebar, then click view report to the right of any epic’s name.
Mouse over any section of the Burnup chart to display the number of stories (or points) accepted and scoped on each date. Click the chart to just see the stories for the date you selected, or choose the date from the Epic story details section.
If you selected the Show Stories display option on the Epics report, that setting carries over to the Epic Detail report. After selecting the Show Points display option, the progress bar, burnup, and counts will change to show point totals instead of story counts.
Only the most recent accepted stories are shown, but you can show and hide all accepted stories in the epic.
Mouse over initials to see someone’s full name, and click the story ID to open the full-page view of that story.