
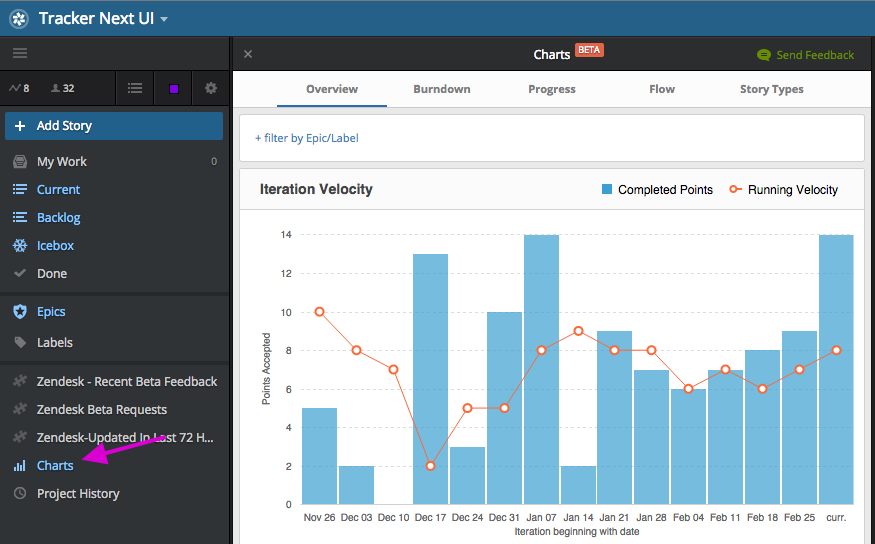
Tracker has just released its new (but still in beta) Charts to a limited number of customers. If you’re interested in checking out the new Charts for your projects, and are willing to send us feedback to help improve the design, please email our beta support.
The new Tracker Charts include:
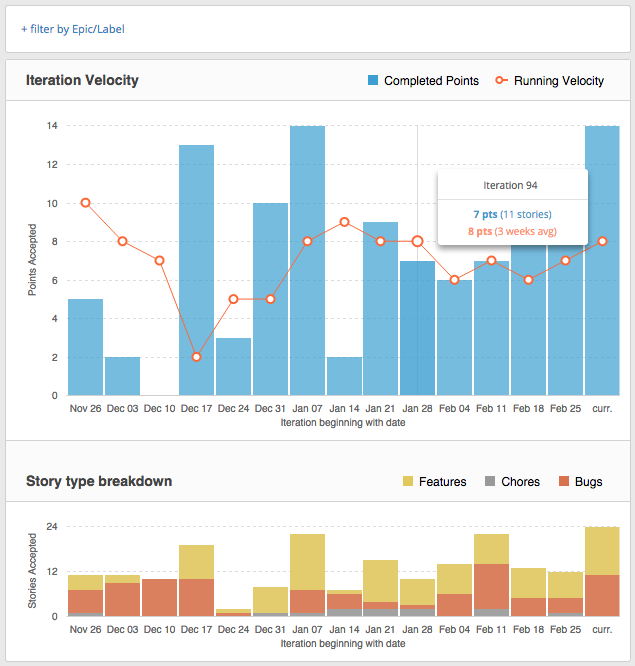
The Overview chart gives you iteration-by-iteration points accepted, along with the running velocity. What’s new is that it now includes an accompanying story type breakdown for each iteration. This gives you a bit more insight into why a particular iteration may have had more (or fewer) points accepted than previous iterations. You can also filter by a particular epic or label to see how it impacted each iteration’s workload.
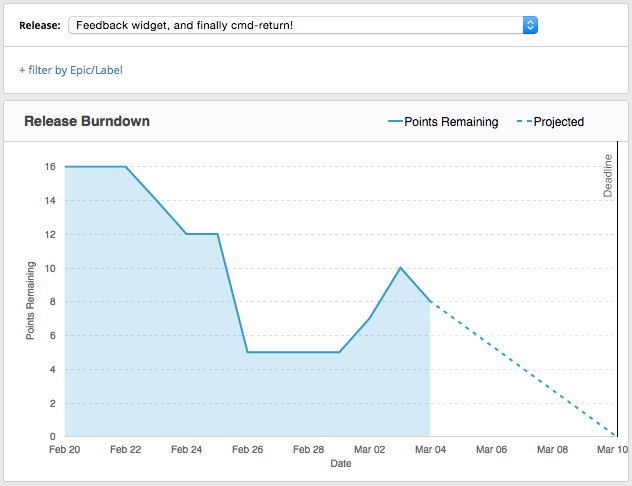
Our Burndown charts now include historically accurate scope changes, including points added. This means that you can see exactly when scope was added to a particular release, and how it affected the overall timeline.
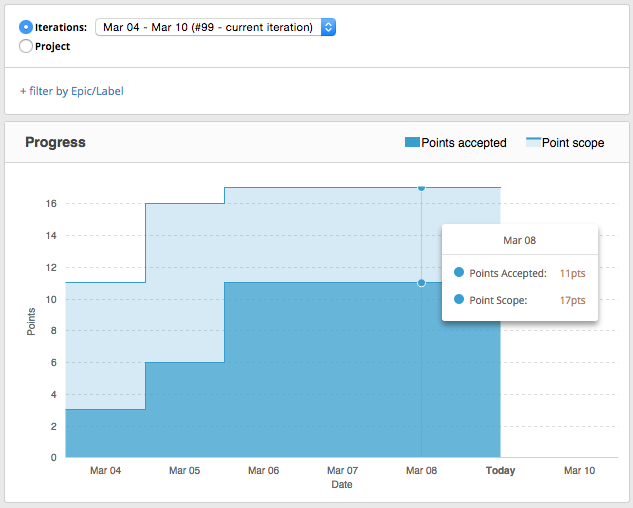
Our Burnup charts, called “Progress,” now include an overall scope line to visualize how your accepted points match expectations. You can also view Progress charts for a specific iteration, or for the entire project.
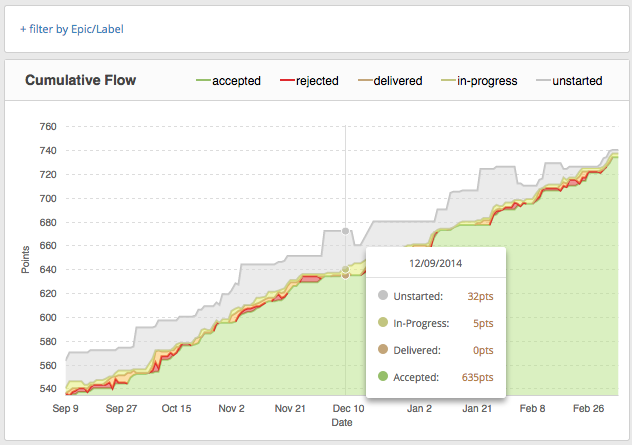
Tracker now has a historically accurate Cumulative Flow diagram, which is a frequently requested, robust, and powerful tool. It shows how stories have changed state over time, when more stories were in one particular state relative to others, and when new stories were added.
For a detailed overview of what this chart can do, check out Pawel Brodzinski’s excellent introduction to Cumulative Flow and its uses.
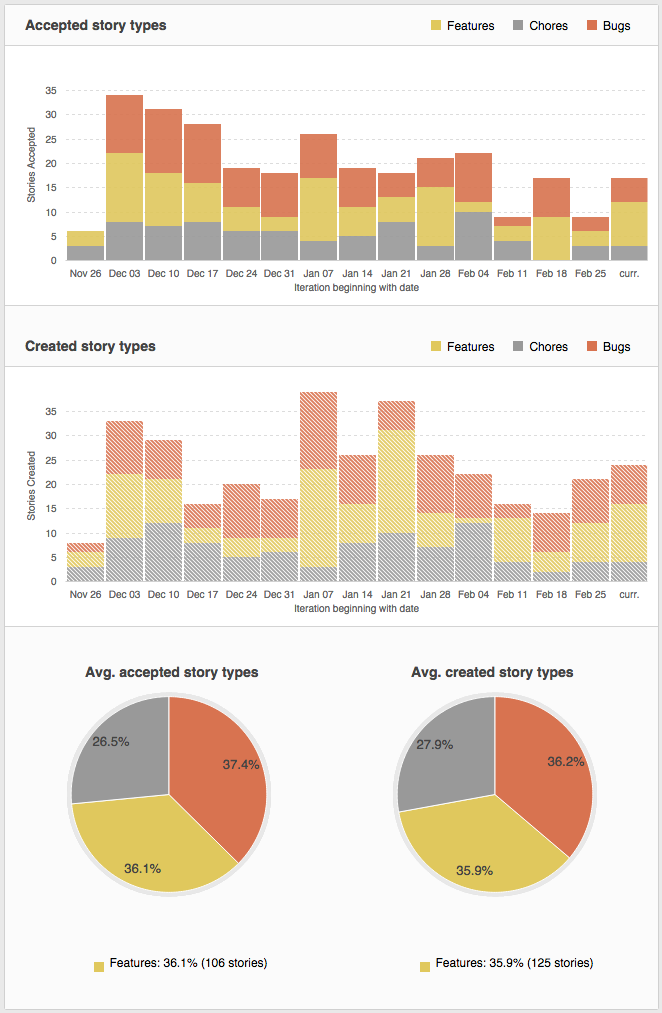
Last, but definitely not least, is our update to the Story Type Breakdown chart. This chart shows you what types of stories (e.g., features, bugs, or chores) were accepted (and added) from one iteration to the next. It helps provide context to iteration progress by showing how many stories of each type were added/accepted.
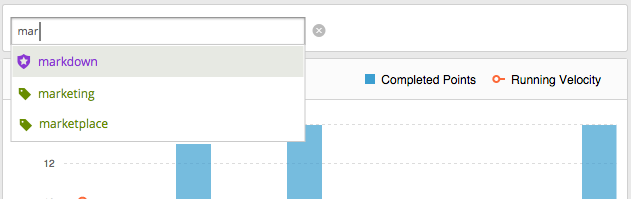
Any of the above charts can be filtered by a specific epic or label. This allows you to visualize how a feature, or a set a features, impacted your overall project cadence and progress.
Now that you have an idea of what the new Charts can offer, have fun with them, and please send us feedback on what you’d like to see (there’s a handy feedback link at the top of the beta Charts panel). Your input is instrumental in improving these charts and future reporting/analytics tools. If you don’t yet have beta access, please email our beta support.
Category: Updates
Tags: Analytics