
We’ve added a new report feature to Pivotal Tracker, to help you analyze how smoothly your project is progressing.
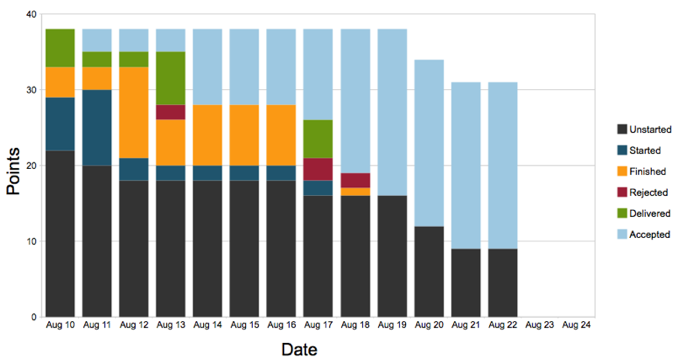
These new Points Breakdown charts help you visualize the progress of your project as stories move through different stages of completion. Stories start out as “Unstarted,” then move on to “Started,” “Finished,” “Delivered,” and then “Accepted” (unless they get rejected). The different colored bars show the point totals of the stories that are in each state at the end of each day. As days pass, you would expect the number of unstarted to go down, and the number of accepted to go up. If any of the other groups are especially big, the chart may help you identify bottlenecks in your workflow.
This breakdown is available for both the current iteration and the previous one. You can also use it to visualize the development of your entire project for the last 15, 30, or 60 days.
To access the Points Breakdown charts, click the Reports link on top of the page, or navigate from your project via the Reports option in the View menu.
Category: Updates