
When we first introduced Pivotal Tracker Analytics, we put a big Send us Feedback! button at the top of the screen. And to our delight, it worked! We received lots of feedback from customers all over the world.
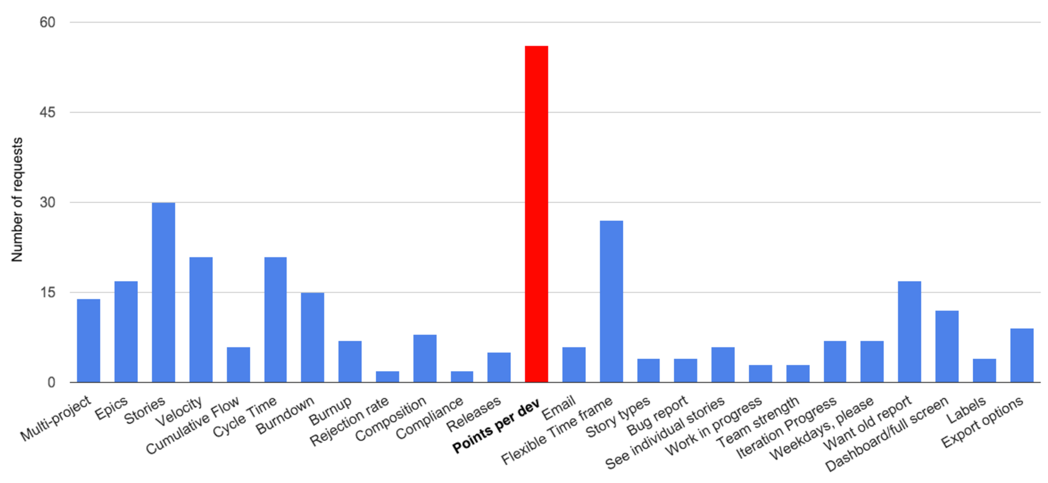
The requests were extremely varied, but one request we heard frequently stood out amongst all the others. With 22% of all customer requests, reporting on points completed (or velocity) per individual developer was by far the most requested feature.
When we asked requesters why they wanted to see points per developer, they clarified that what they’re really looking for is a way to find inefficiencies in their team and correct them: who is taking on too much work (or too little) and who is working too much on one area instead of another. As a desire to improve one’s team, this makes perfect sense.
At the same time, we are creatures of Agile, and measuring work per individual developer or as a team—whether it’s points, stories, or really any metric—is an anti-pattern in Agile development, and counter to coaching that Pivotal Labs provides. We see software as a team sport, with small teams owning the outcome of their project or product. We believe in pairing to reduce problems, keep teams moving at a predictable pace, and to reduce a team’s “bus factor” (or “lottery factor,” if you prefer optimism to brutal fatalism).
Many of us have experience in environments where our work is gauged by the total number of points (or even stories) completed, and rarely has this resulted in a positive outcome.
Story points should represent consensus within the team. They reflect the estimated complexity required to accomplish the acceptance criteria written in the story. More importantly, teams estimate stories together to uncover potential risks with a piece of work, and to have a shared understanding of the proposed solution. It’s also a way to break down stories that are too large into more manageable (and trackable) chunks.
Story points were never designed to be a measure of actual work completed. When you begin to assess someone by collective estimates, you are effectively changing the meaning of those estimates.
“Using story points or ideal days to measure productivity is a bad idea because it will lead the team to gradually inflate the meaning of a point—when trying to decide between calling something ‘two points’ or ‘three points,’ it is clear they will round up if they are being evaluated on productivity as measured by the number of story points (or ideal days) finished per iteration.” —Mike Cohn, in Should Companies Measure Productivity in Story Points/Ideal Days
When you peg a single metric (like points) to employee performance, those employees are incentivized to improve upon that metric. Salespeople want to sell more of their particular product, widget manufacturers want to churn out more widgets, and engineers who are graded by individual point contribution want to be associated with more completed points.
One way for engineers to improve their point count is to complete more stories, but another obvious means is to inflate the point value assigned to stories. Even in ideal environments where teams point together, they will collectively alter the meaning of “point” when they know that they are being scrutinized based on how many they deliver.
This arms race can lead to a situation where the project manager can’t trust the point values their team is assigning to tasks, making future estimation difficult if not impossible.
Software teams are often composed of people with a strong set of skills in one area, and a breadth of skills in another (i.e., a “T-shaped” skillset).
Measuring a developer’s work by their completed points dissuades them from trying something in a subject matter with which they may be unfamiliar. Since they are already comfortable with a particular vertical of work, they are more likely to choose to do that work because accomplishing it is more assured. Consciously or not, they are effectively blocking others from learning those skills.
The ramifications of this behavior translate into a higher lottery factor for the entire team. The idea is that if a member of a team with a strong concentration of knowledge is unexpectedly lost (i.e., “hit by a bus”), the team will have a major gap in subject matter expertise. Recovering from such a loss will take a great deal of time, delaying project timelines considerably and increasing risk to the health of the project.
We’ve known for some time that experienced PMs focus less on how quickly their team moves and more on their team’s predictability. This is because predictability enables confidence: it allows someone a better idea of when something might be done, with fewer surprises along the way.
Velocity and points accepted are often the first (and sometimes only) metric to which PMs pay attention. Instead of just looking at the velocity numbers in isolation, experienced PMs track trends in velocity over time for signs of peaks and valleys, known as volatility. Labs PMs have reported that higher point volatility can be an indicator of a troubled project.
A high degree of volatility can indicate several things:
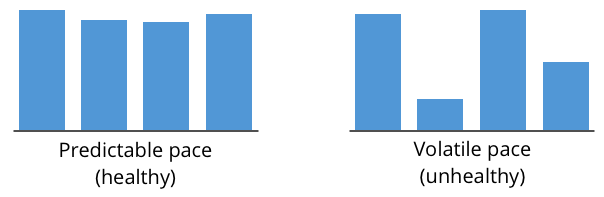
Below is an example of a highly predictable project. Points accepted vary minimally from one iteration to the next, velocity is relatively stable, and volatility is very low (18%).
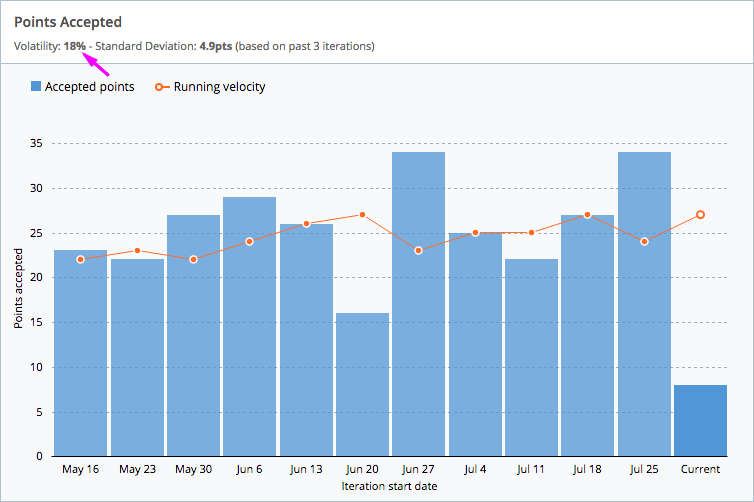
A predictable project (like the one above) has consistent velocity and low volatility.
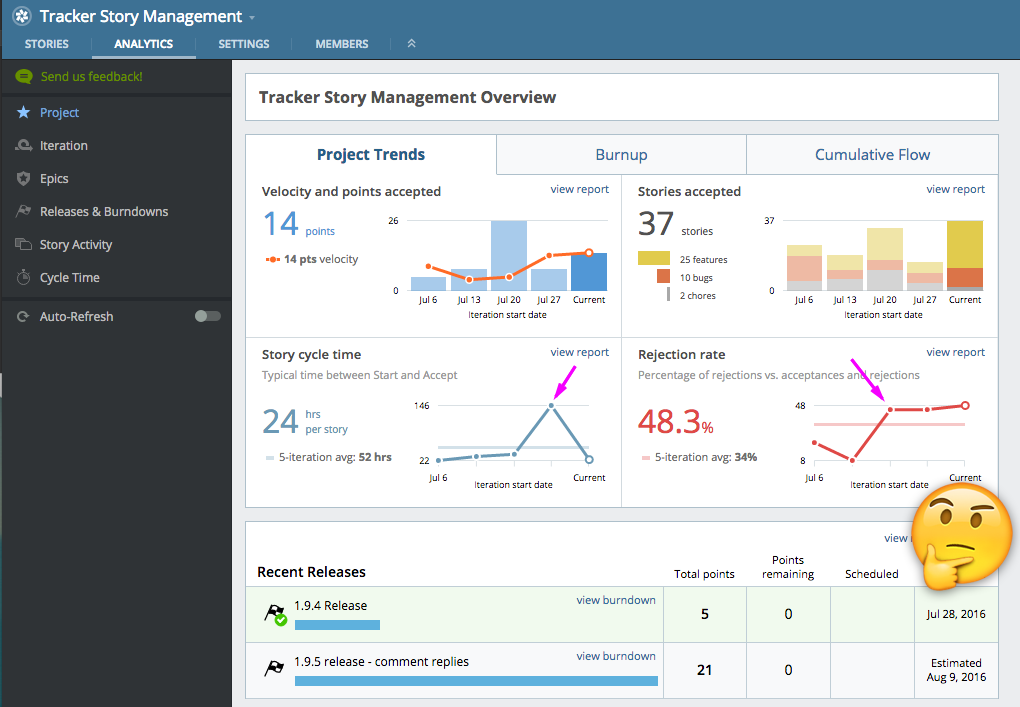
Cycle time is the amount of time between the start of a story and its acceptance. Rejection rate is the percentage of stories that were rejected in a given iteration.
Like velocity, these two metrics are more valuable in the context of several iterations. Over time, cycle time and rejection rate can tell you a story about the predictability of a project that velocity might be leaving out.
Below are two graphs from our Analytics tool. This project’s last few iterations had stories taking longer than expected. You can see that we had a spike in both cycle time and rejection rate, which may explain the difficulties. Identifying, understanding and addressing why these blips in story delivery pop up is an important step in improving your team’s health.
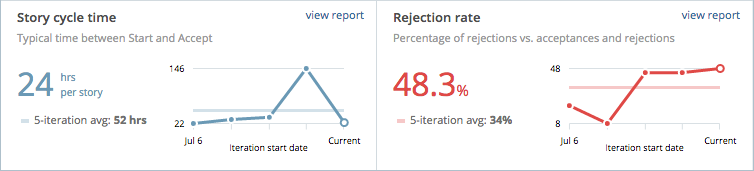
Spikes in cycle time and/or rejection rate can signify bottlenecks in your process.
A healthy team delivers a mix of features, bugs, and chores proportional to the incoming features, bugs, and chores in each iteration. This keeps projects balanced and prevents technical debt (bug buildups), while also consistently delivering business value.
One sign of an unbalanced team is a prevalence of “bug iterations” during which the team pays down built-up technical debt for a week or more. This implies that unaddressed problems have built up over time, and have become so bad that an entire iteration has been dedicated to eliminating them. The side effect of this is an unwieldy team delivery cadence that contributes to an unpredictable project.
Below is an example of a project addressing a healthy mix of features, bugs, and chores during each iteration. The pie chart shows the cumulative incoming (“created”) and closed (“accepted”) features, bugs, and chores over nine iterations.
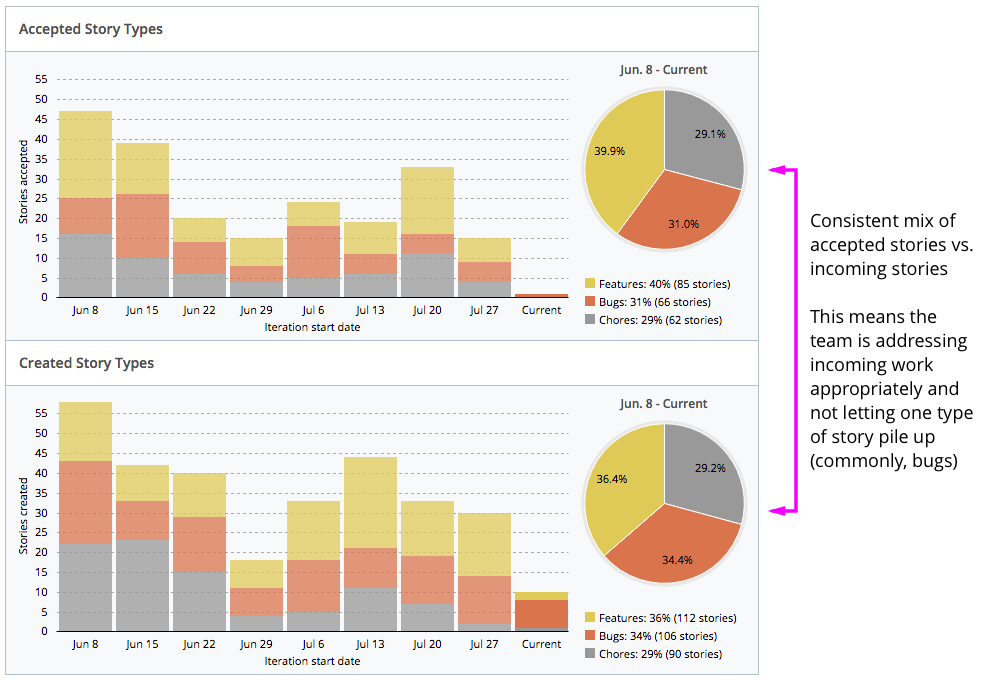
At the end of every iteration, take a peek at your team’s Analytics page. Don’t necessarily try to analyze everything right away, but look to get a feel for the flow of your project. Is your velocity consistent? How about your story types? Are there any bumps in your cycle time or rejection rate?
Look at your project metrics as a whole. Do any inconsistencies stand out?
If you see any inconsistencies, dig into those charts. Look at the individual stories that are causing problems, and analyze why. In the case below, the cycle time looks high on a number of stories because they are waiting in the delivered state (i.e., waiting for acceptance) for too long.
Then, talk to the team. Are the testers overwhelmed? How about the PM? How do these long delivery times impact the team?
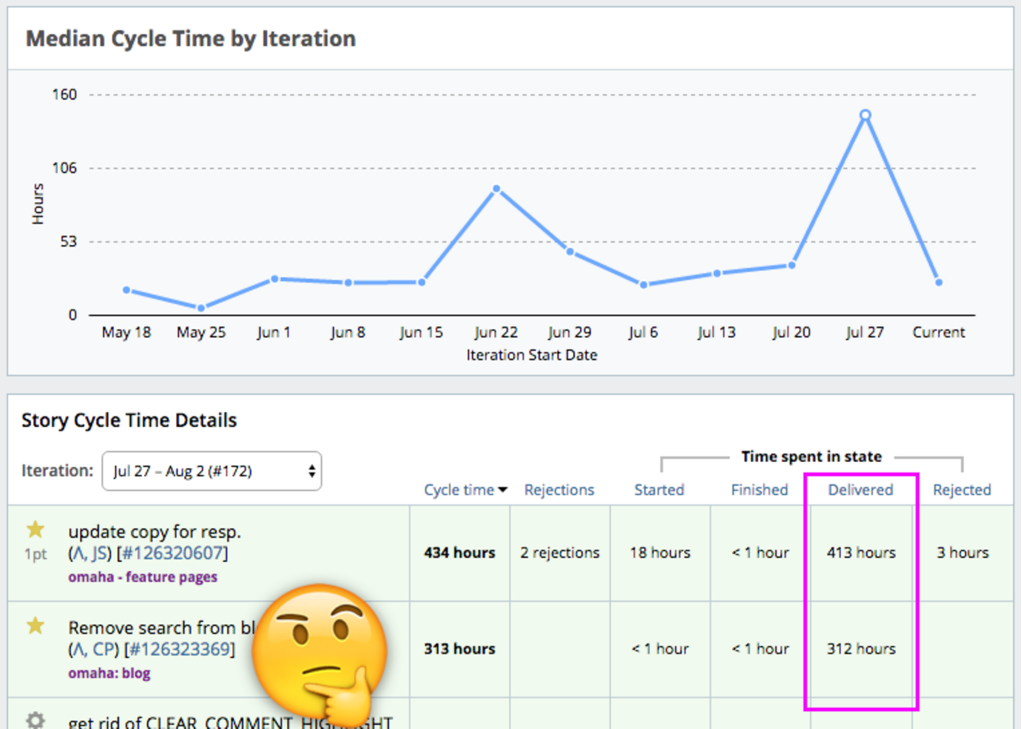
Once you’ve identified overall inconsistencies, dig into the details. In this case, stories waiting for acceptance caused the bottleneck.
Every week, sit down as a team and explore your project Analytics together. What you’ll notice is that as a PM, you won’t need to do much in the way of directing, and your team will start to pick apart went went wrong (if anything) and what you can do to improve. On our own team, it’s usually the developers who clamor to see the Analytics rather than the PM suggesting it.
This is exactly what you want: your team identifying and addressing problems as a group. The only thing you need to watch for at this point is people dishing out individual blame or defensiveness; encourage your team to resolve these issues together.
In the end, you’ll find you have a more cooperative project team that resolves issues on its own. Almost as important, you’ll have a much more predictable process for shipping new features.
Category: Productivity
Tags: How to