Screenful
Get this integration
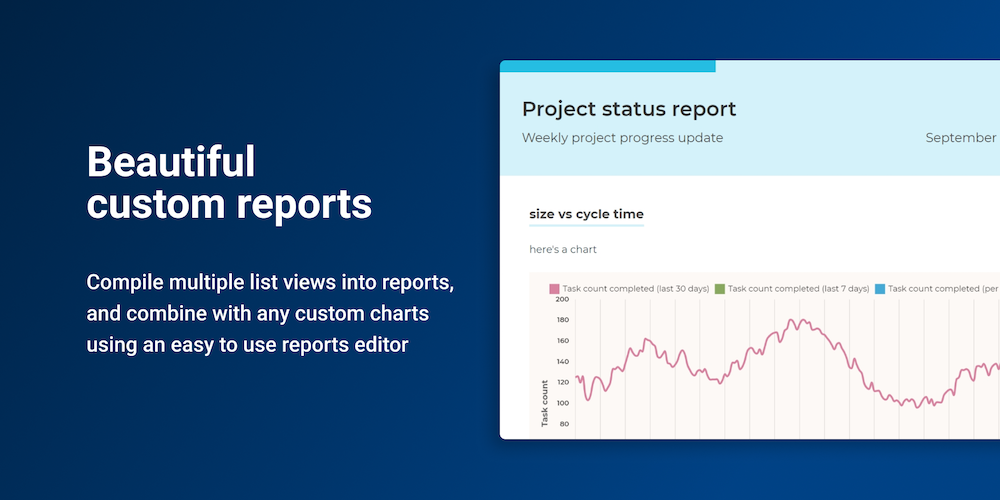
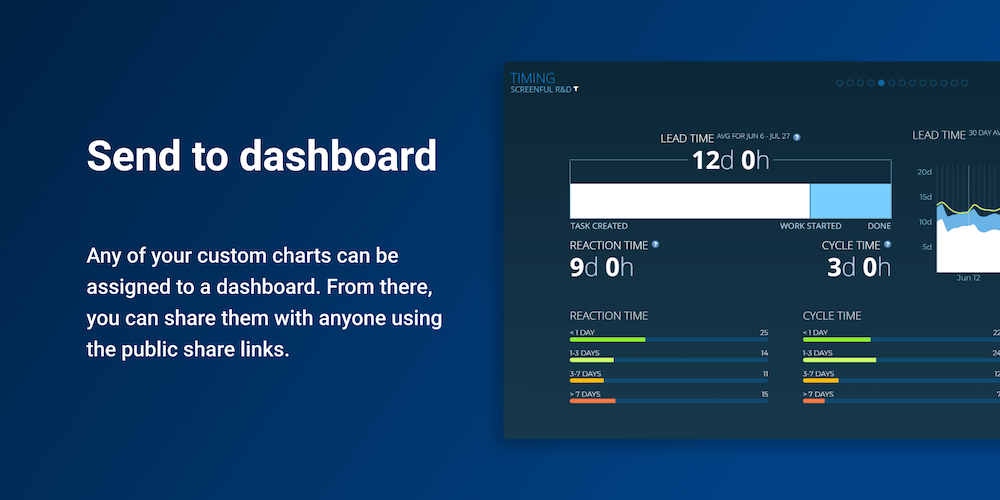
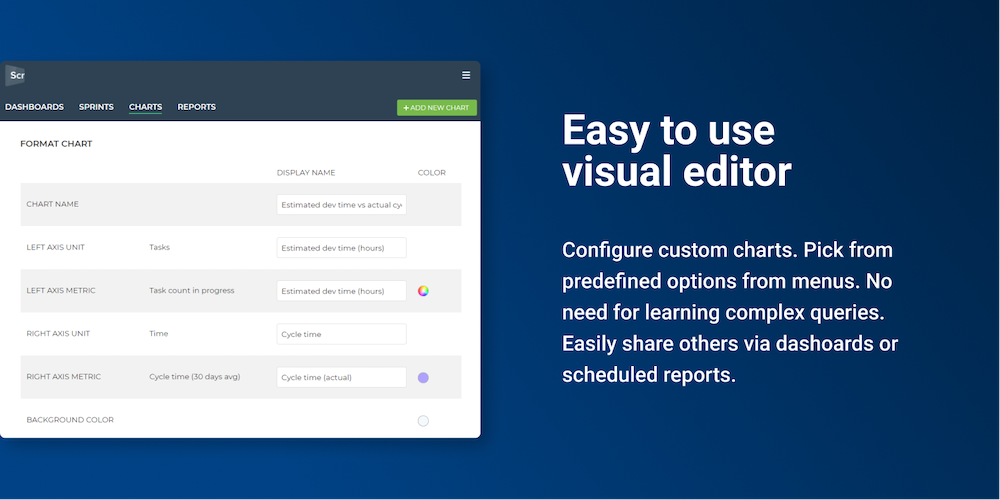
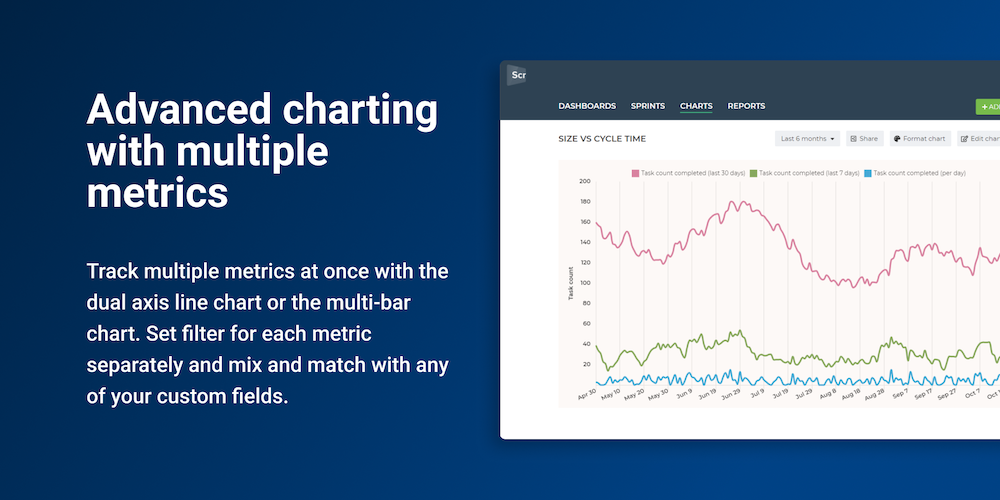
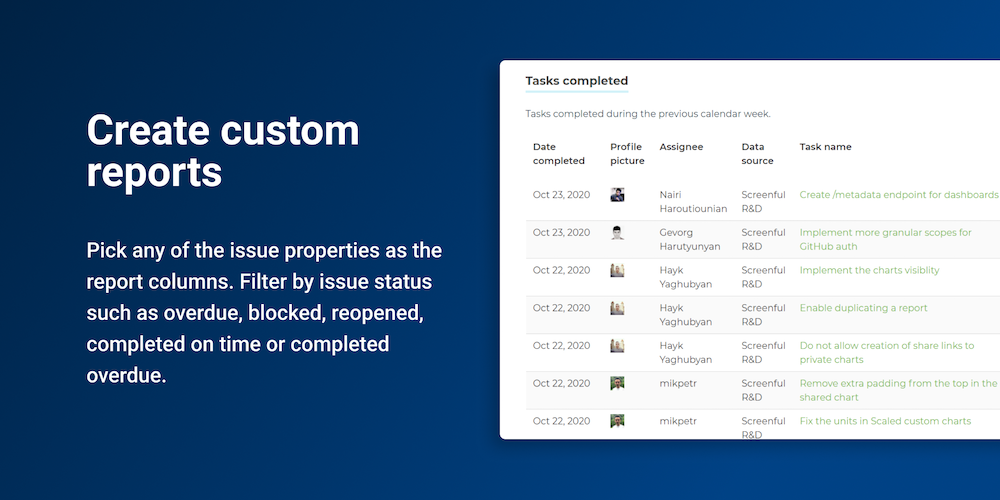
The Reports by Screenful is an easy-to-use business intelligence solution for Pivotal Tracker that makes it easy to build charts and reports from your task data and share them with your colleagues.
- Track all of your projects, see correlations and analyze trends
- Create interactive charts from your Pivotal Tracker data
- Track multiple metrics at once with the dual axis line chart or the multi-bar chart
- Easily share reports vial email or Slack
Category:
Reporting
