
If you were invited to join an existing Tracker project, clicking the link in your invitation email will take you to the project.
If you signed up for Tracker yourself, once you’ve clicked the link in your confirmation email and activated your Tracker login by setting your password, you’ll land on your Tracker Dashboard.
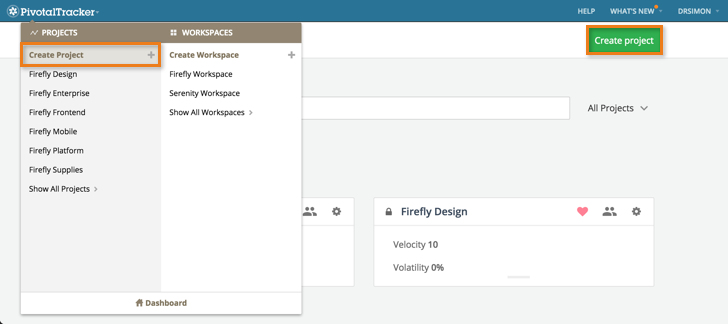
Whether or not you’re already invited to any projects, you can create a project by clicking Create project located at the top right of the Dashboard. You can also click the Pivotal Tracker logo in the top left and select Create Project from the drop-down menu.
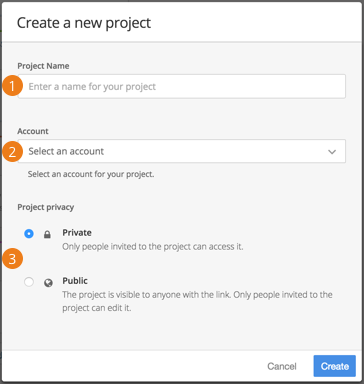
Whichever you select, you’ll see this dialog:
-
After you type in a Project Name, you have the following options:
-
Account: If you joined a Tracker project via an invitation, you’ll see one or more projects on your dashboard when you first sign in, but you may not yet have an account where you can create projects. If you need to create projects in your company’s account, ask the account owner (shown in the Account drop-down) or an account admin for that Tracker account to give you project creator permission. If you are already a project creator or admin for a Tracker account, you can choose that account from the list. You can add your own new account by clicking on the Account menu, (however, even if you give it the same name as your company account, it is totally separate to it).
-
Project privacy: Choose Private to restrict access to your project to people that are invited to it. Choose Public if you want to make the project publicly visible, which will allow anyone read-only access to it, whether or not they are signed into Tracker. For example, if you’re working on an open-source project, you can make it publicly visible). Only invited members can make changes to public projects. Public projects don’t count against the account’s plan limits. You can always change a public project to be private later, under Project Settings.
After you’ve chosen your options, click Create. If this the first time you have created or visited a Tracker project, you’ll have the option to view a short video and click through a brief feature tour, which we highly recommend.
After creating a new project, you’ll see a project view like the one below. By default, it has two panels open: Current/Backlog, and Icebox. You can split Current (the iteration currently in progress) from the rest of the Backlog by clicking the Panel actions menu at the top of the Current/Backlog panel, and selecting Split current & backlog.
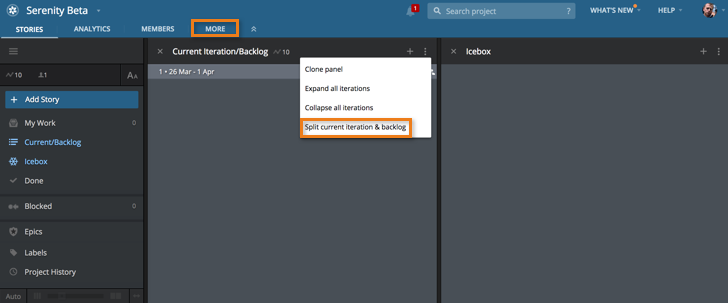
Click the MORE tab in the top nav to edit Project Settings (if you’re a project owner), such as estimation point scale and iteration length. (If you’re not a project owner, you can only view the project settings.) The same menu will also allow you to document the project’s details/specs within the Project Profile, view the list of project members, run reports for that project, configure external integrations, and import or export a CSV file of project stories and epics.
A tour of your project view
Be sure to take the Feature Tour when you first create a project in Tracker. If you skipped it earlier, or just need another look, you can access it from the Help drop-down menu.
Sidebar
You can see your project’s average velocity at the top left of the sidebar, as well as in the Current panel header (velocity in the project shown above is 10). The Density button lets you change the amount and type of information in the story previews displayed in your Tracker window. You can click Auto at the bottom left of the sidebar to switch to Fixed mode, where you set the panel width. If you want more room for panels, click the sidebar toggle
![]() at the top left, to collapse it. When the sidebar is collapsed, mousing over the control auto-expands the sidebar until you mouse away. Or, click the control again to toggle the expanded sidebar back on.
at the top left, to collapse it. When the sidebar is collapsed, mousing over the control auto-expands the sidebar until you mouse away. Or, click the control again to toggle the expanded sidebar back on.
Panels
The Panel actions menu at the top right of each panel contains additional actions that are relevant to that panel type. For example, you can select all stories in the panel for further actions, or clone the panel. To begin adding stories, click the + button in the header of the appropriate destination panel for the story. See more on Tracker’s panels below.
Exploring an example project
Let’s walk through an example project to introduce other elements of the project stories view.
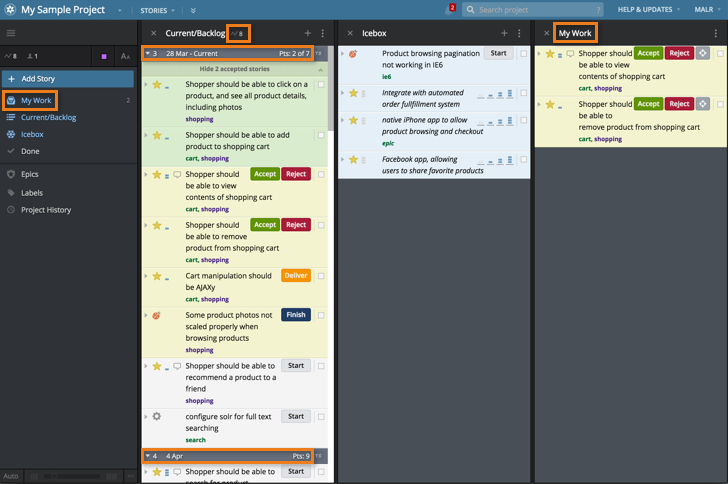
Notice the My Work panel. It displays stories assigned to you that have not yet been started, the started stories that you own, and all stories in delivered state (i.e., ready for to be accepted or rejected) for which you are the requester.
Also, the user here has combined the Current and Backlog panels into one using the Panel actions menu at the top right of the panel. The top of the Current/Backlog panel shows the project’s average velocity of 8 points. The grey iteration marker for the current iteration shows that it’s iteration number 3, the start date of the iteration is March 28, the sum of story points in the iteration is 7, and 2 points are already completed.
The next story in the Backlog is a 3-point story. That won’t fit in the current iteration because then the velocity would exceed the average of 8 points. That’s why there’s another iteration marker—iteration number 4—starting April 4. Interestingly, it has a point total of 9, because there are only 7 points in the current iteration. Tracker assumes that your velocity will average out to 8, and plans your future iterations accordingly. Read more about Tracker’s automatic backlog planning in Understanding velocity.
Stories that are not yet prioritized live in the Icebox panel. Don’t let your Icebox become a graveyard of forgotten stories; keep it relevant using the tips in Icebox management.
In the sidebar, you can see more panels and add to your project layout.
-
The Done panel displays iterations that have been completed, with all the stories accepted in each one, ordered by the accepted at date.
-
Epics represent the big-picture themes and large features that are made up of multiple feature stories.
-
The Labels panel displays a clickable list of all labels in the project. Labels can help group related stories, make dependencies among stories more visible, and help you find stories quickly. Mouse over each label in the list to see options. Anywhere you see a label displayed, you can click on it to bring up all the stories associated with it.
-
The Blockers panel displays all stories that contain one or more blockers.
-
Project History lists all the changes made to the project and its stories.
Open up these panels in your own project to get more familiar with what you can display in your Tracker window. The default panel order puts Done on the left and the Icebox on the right, followed by My Work and other panels, but you can drag them into any order you prefer.
You’re ready to start adding stories to your project. If you want to migrate stories over from another tool, there are several ways to do that.
Project settings
Only project owners can change Project Settings. If you are a project owner, click the MORE tab in the top nav of your project view. Or, you can click the Settings cog wheel
![]() on the Dashboard for the project you want to change. Project members can only view project settings. See the list of Project Settings for more information.
on the Dashboard for the project you want to change. Project members can only view project settings. See the list of Project Settings for more information.
To dig deeper into Tracker projects and all their capabilities, check out Using Projects in the Getting More out of Tracker section.