
Analytics are charts and reports that help you see the big picture and useful trends in each of your projects.
Analytics are designed to help you see what’s being worked on, how things are progressing, and where your team might need help. They not only show the high-level progress on your work—allowing you to manage scope creep and identify bottlenecks—but also let you filter and drill down into specific stories, epics, and iterations.
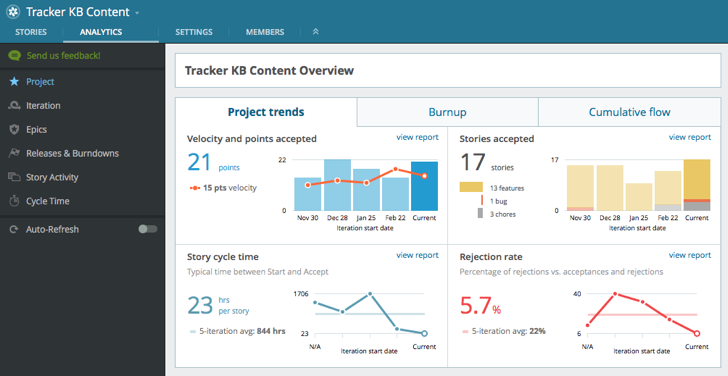
Project Overview allows you to see high-level metrics on your project, and easily access these other charts and reports:
-
Velocity charts the number of points accepted in each iteration, the running velocity, and the volatility of the project.
-
Cycle Time demonstrates the time spent on stories by state, story type, or points, and shows all the stories in a given iteration.
-
Story Composition shows the distribution of accepted and created stories of each type over time.
-
Rejection rate (part of the Cycle Time report.) shows the rate at which stories were rejected and the amount of time before they were restarted.
-
Burnup tracks progress toward a project’s completion, showing how many points have been accepted out of the total for the shown iterations.
-
Cumulative Flow shows the number of stories in each state (i.e., stories that are are done, in progress, and not yet started) over time.
-
Iteration report gives an overview of progress made in a given iteration, including a breakdown of accepted stories by epic.
-
Epics report shows the progress of large features and themes, with the ability to drill down to understand how the scope has changed over time.
-
Releases and Burndown reports lists upcoming releases, allows you to see completed releases, and view a Burndown chart for each.
-
Burndown chart shows story progress and the remaining points/stories in the selected release, along with the projected burn-down line (assuming the current velocity is maintained).
-
Story Activity report displays detailed story-level activity and progress for a given iteration or date range.