
We’ve released the first of a couple of updates to the dashboard, aiming for a cleaner, clearer view of your projects.
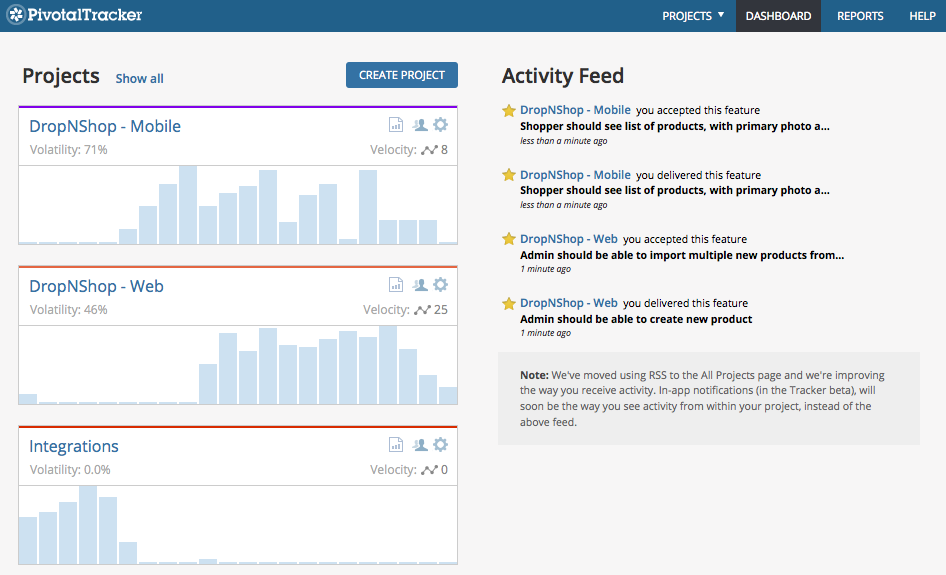
In this update, as well as a fresh new look, subscribing to RSS feeds has moved and there’s the addition of each project’s volatility.
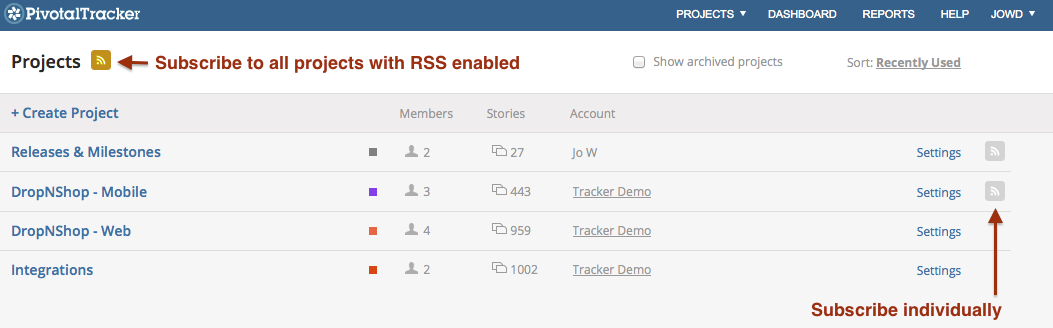
You can now subscribe to the activity in projects, using any blog reader that supports Atom, via the Projects page. If you don’t see any RSS subscribe icons, it’s because they only appear if the “Enable RSS/Atom” option is selected in a project’s Settings.
Volatility is a measure of how consistent your project’s velocity is. While velocity shows you what will be done, based on the rate at which recent work has been completed, volatility shows how reliable that is. A low volatility tells you that estimates are accurate and that you can be confident about what will be done in each iteration.
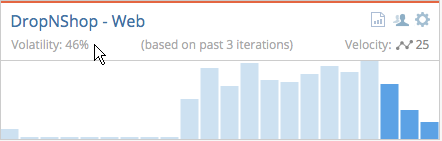
You can see information about your most recently visited projects on the Dashboard, including their current volatility. This is a percentage, computed using the number of recent iterations set in each project’s settings for “Velocity Strategy” by a project owner. On mousing over the volatility, you’ll see which iterations were used to calculate volatility and velocity.
As well as the Dashboard, the Velocity chart, in a project’s Charts panel, shows the running volatility over the project’s visible history. That history is the number of completed iterations shown in the Done panel. The default “Number of Done Iterations to Show” can be updated in Project Settings by a project owner.
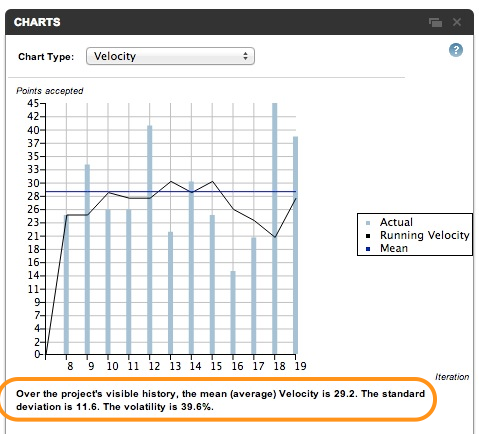
In case you’re curious, volatility is the relative standard deviation of the effective completed points divided by average effective completed points:
volatility = (std dev (weekly effective points)/average (weekly effective points)) * 100
We determine effective points as follows:
effective_points = completed points/(length of current iteration/project iteration length + team strength/100%)
Also, paused iterations (team strength = 0%), are excluded from effective point calculations.
For examples and more on the importance of volatility and how it can help your team’s performance, please see: It’s the Volatility That Will Kill You and Volatility for Product Managers.
In-app notifications (in the Tracker beta), will be the way to see activity, right there within your project. They replace the activity feed on the dashboard, so we’ll remove that, leaving room for a whole new view of what’s going on with your multi-project workspaces. Did I say “spaces” plural? Why yes, I did. That’s another of the beta features we’re working on, to make a good thing even better.
As ever, do get in touch via email, use the beta In-App Feedback link and if you don’t already, please follow us on Twitter for updates.
Category: Updates