
It’s official! Pivotal Tracker’s new project Analytics features are now out of beta!
As thousands of you have already discovered, Analytics bring a new level of visibility to your project and allows you to easily uncover bottlenecks and continuously improve your team’s performance. It’s a collection of simple but powerful reports that give insight into your project’s cadence, including fluctuations over time. You get a high-level view of progress, and the power to easily drill down into details.
Here’s what some of our customers have said about Analytics recently:
“We love the new reports, they have been very helpful for us to communicate expectations with managers, as well as optimize our cycle time.”
—Dennis Stevense, Lead Software Engineer, Streamline
“Loving Pivotal Tracker’s new analytics! Helpful and practical, with all the insight we were looking for.”
—Matthew O’Neill, COO, SameWave
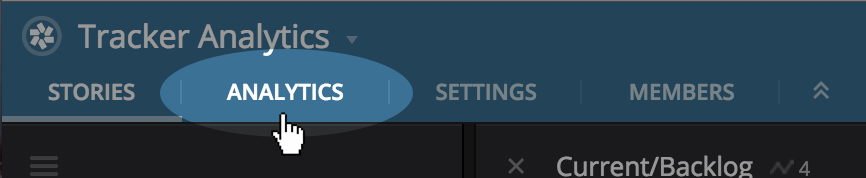
Analytics replace Tracker’s old progress and points breakdown reports, as well as the in-panel charts. The new Analytics are one click away from your project—just use the Analytics tab in the new navigation at the top of the page. This is also how you can get to your project settings and members pages (it replaces the old cogwheel menu in the project sidebar).
Analytics provide a number of ways for your team to explore your project data:
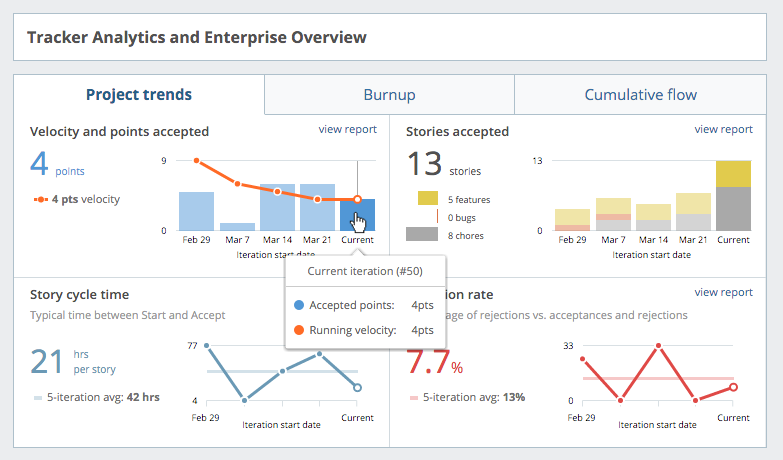
Spot high-level metrics and trends in one glance, and drill down easily to various detailed reports and charts, including Velocity, Burnup, and Cumulative flow.
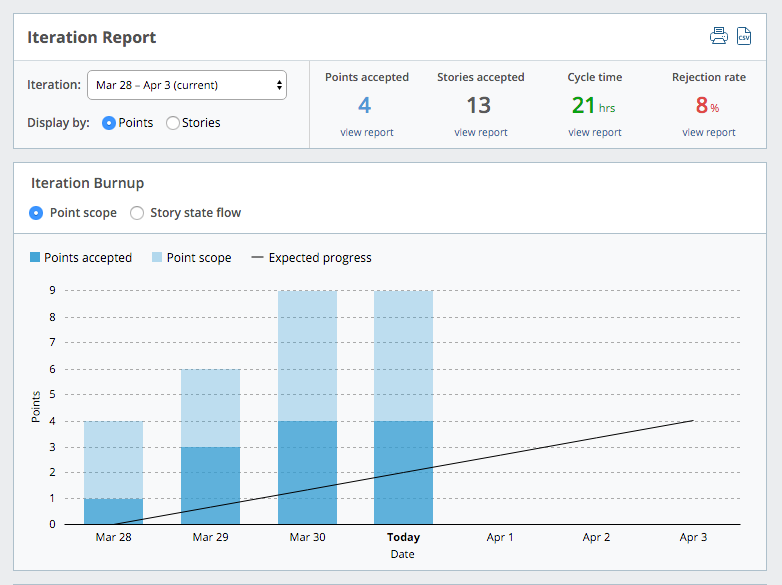
Get a snapshot of progress made in a given iteration, with iteration-level burnup and flow charts.
View feature-level progress, and drill down to detailed reports that help you understand how scope changed over time.
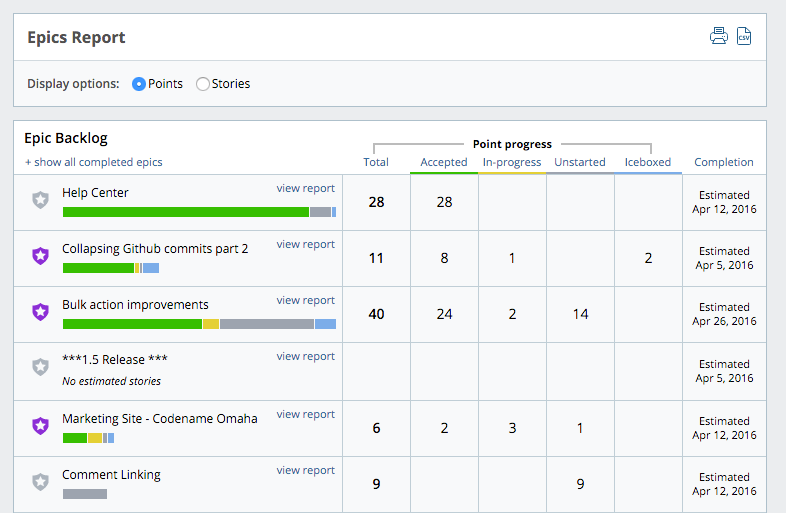
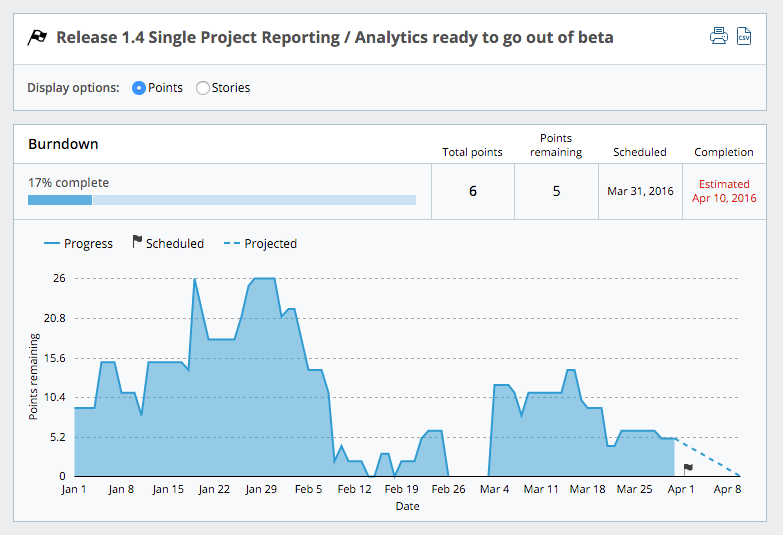
Visualize historical progress as well as what’s left remaining for important milestones.
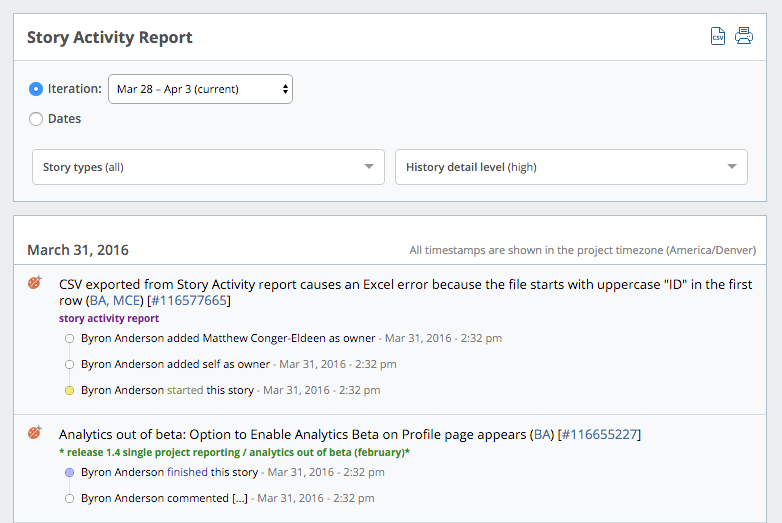
See and share story-level progress for a given date range or iteration.
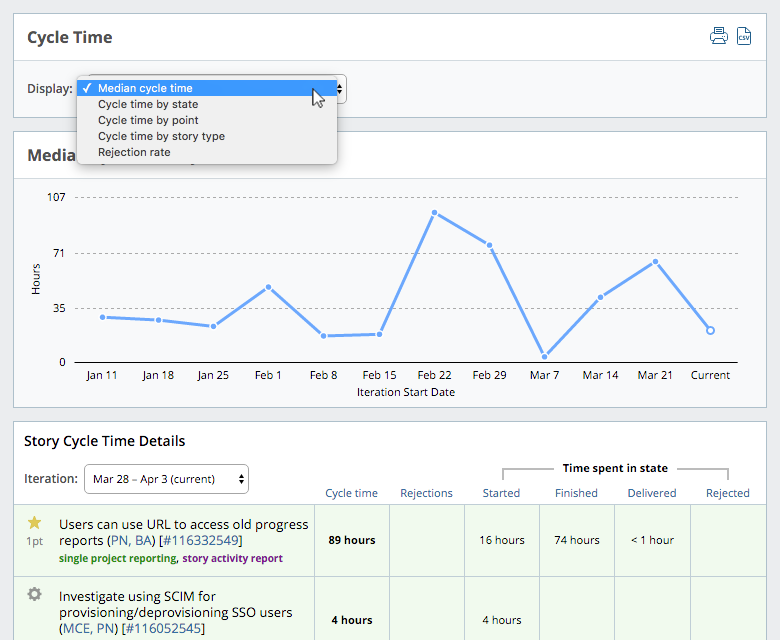
Find out how time was spent on stories trends over time, and which stories have taken the longest.
Click “view report” anywhere you see it to drill down to a more detailed report (e.g., reports for individual releases that also include release burndown charts). These charts allow you to filter by label or epic, or see a list of stories for a given iteration by clicking on that iteration in the chart.
Note: Currently, Analytics allow you to see up to six months of historical data.
We will be publishing a series of Analytics-related blog posts over the next few weeks, so be sure to follow us on Twitter to stay informed.
One of the next steps is improved cross-project analytics and visibility, and we’re looking for customers that might be willing to help us shape these. If you would benefit from being able to see progress, trends, or status across multiple projects, please get in touch!
Your feedback throughout the beta process has been instrumental in getting Analytics to where they are today, so thank you! But please don’t stop—this is just one milestone on a long journey. Continue to send us feedback via the widget at the top left of the Analytics page, or email us to share your comments and suggestions.
Category: Updates
Tags: Analytics